Table
All results are displayed in the results tab in the table.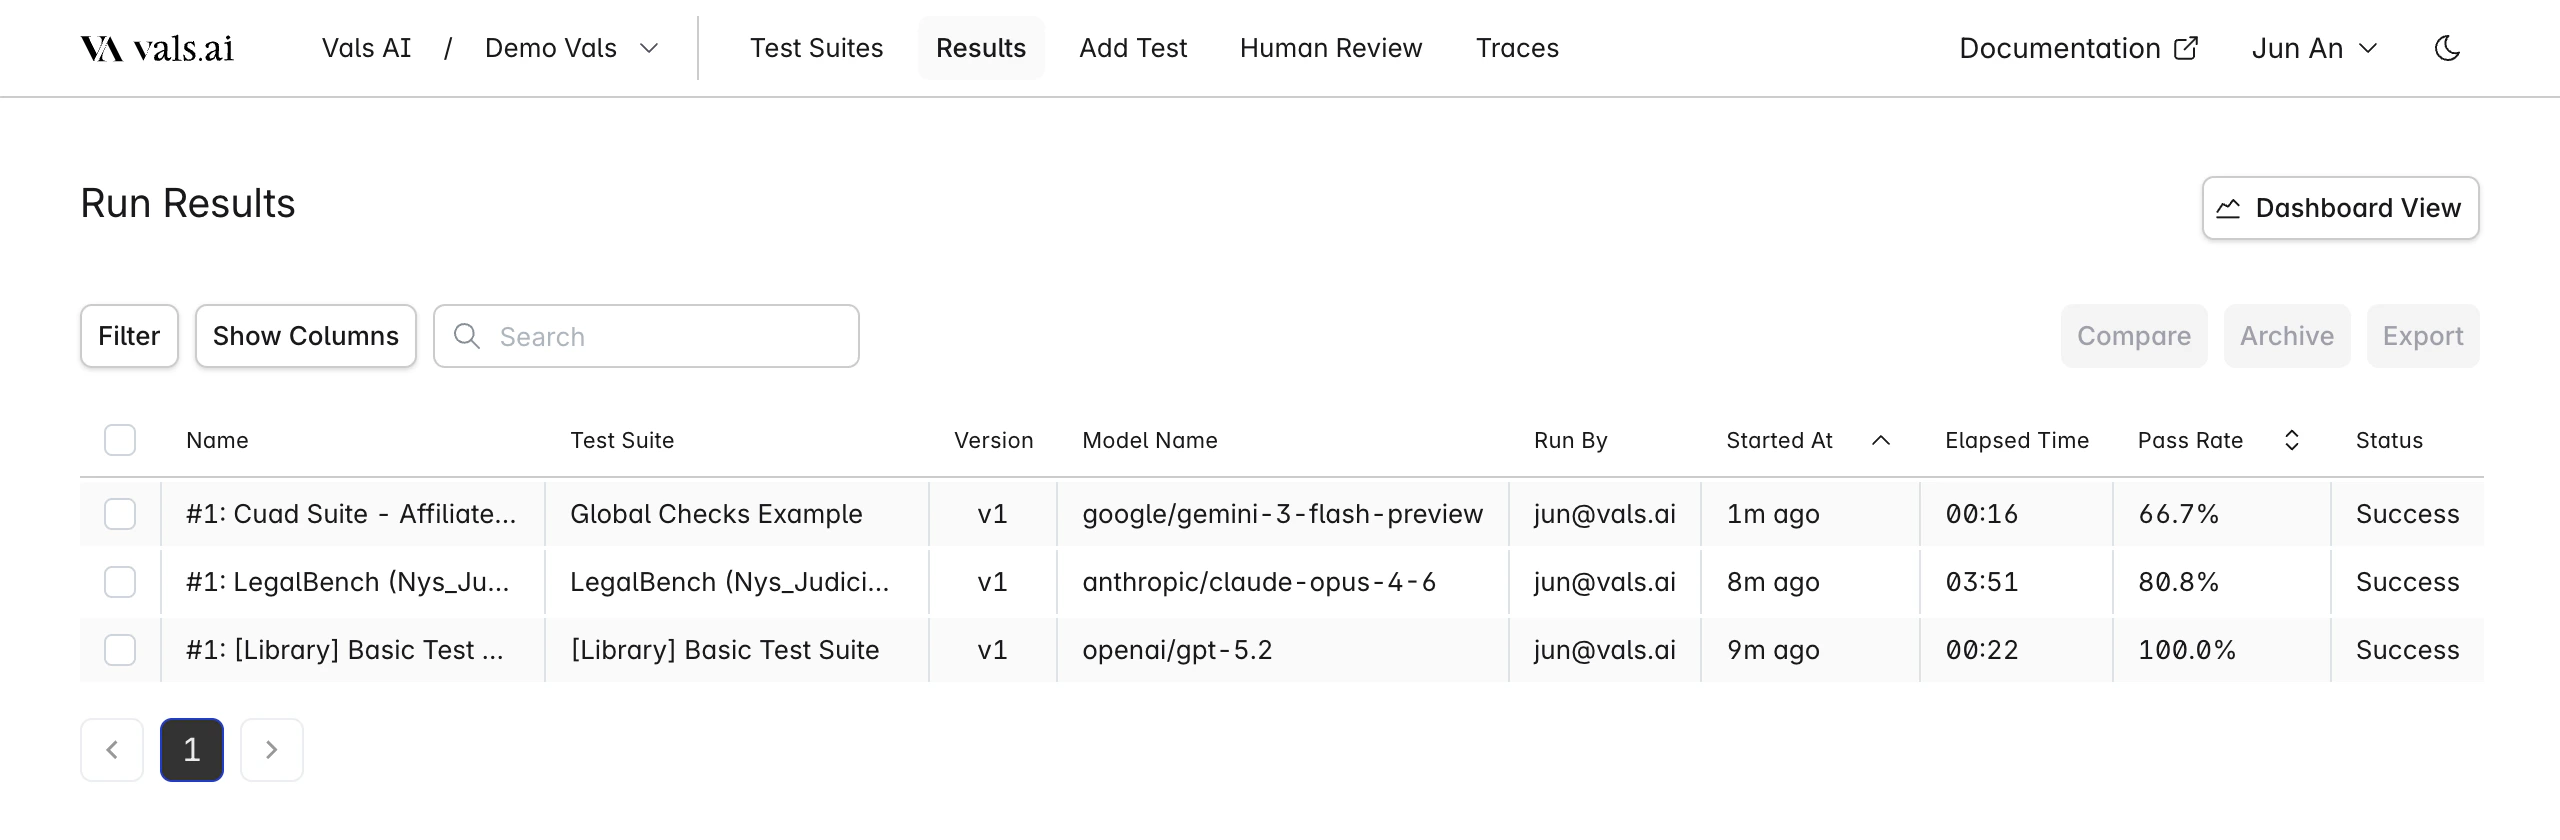
| Feature | Options/Actions |
|---|---|
| Filter by | Model Status Test Suite Run By Archived |
| Search Includes | Run Name Test Suite Name |
| Sort by | Pass Rate Run Date |
| Show Columns | Toggle visibility of individual table columns |
- Compare: Compare the results of two selected runs. They must be from the same test suite.
- Archive: Archive a selected run. It will no longer be displayed unless the
Archivedfilter is selected - Export: Export one or more selected runs to a CSV file.
Single Run
Clicking on a row will bring you to the single run page.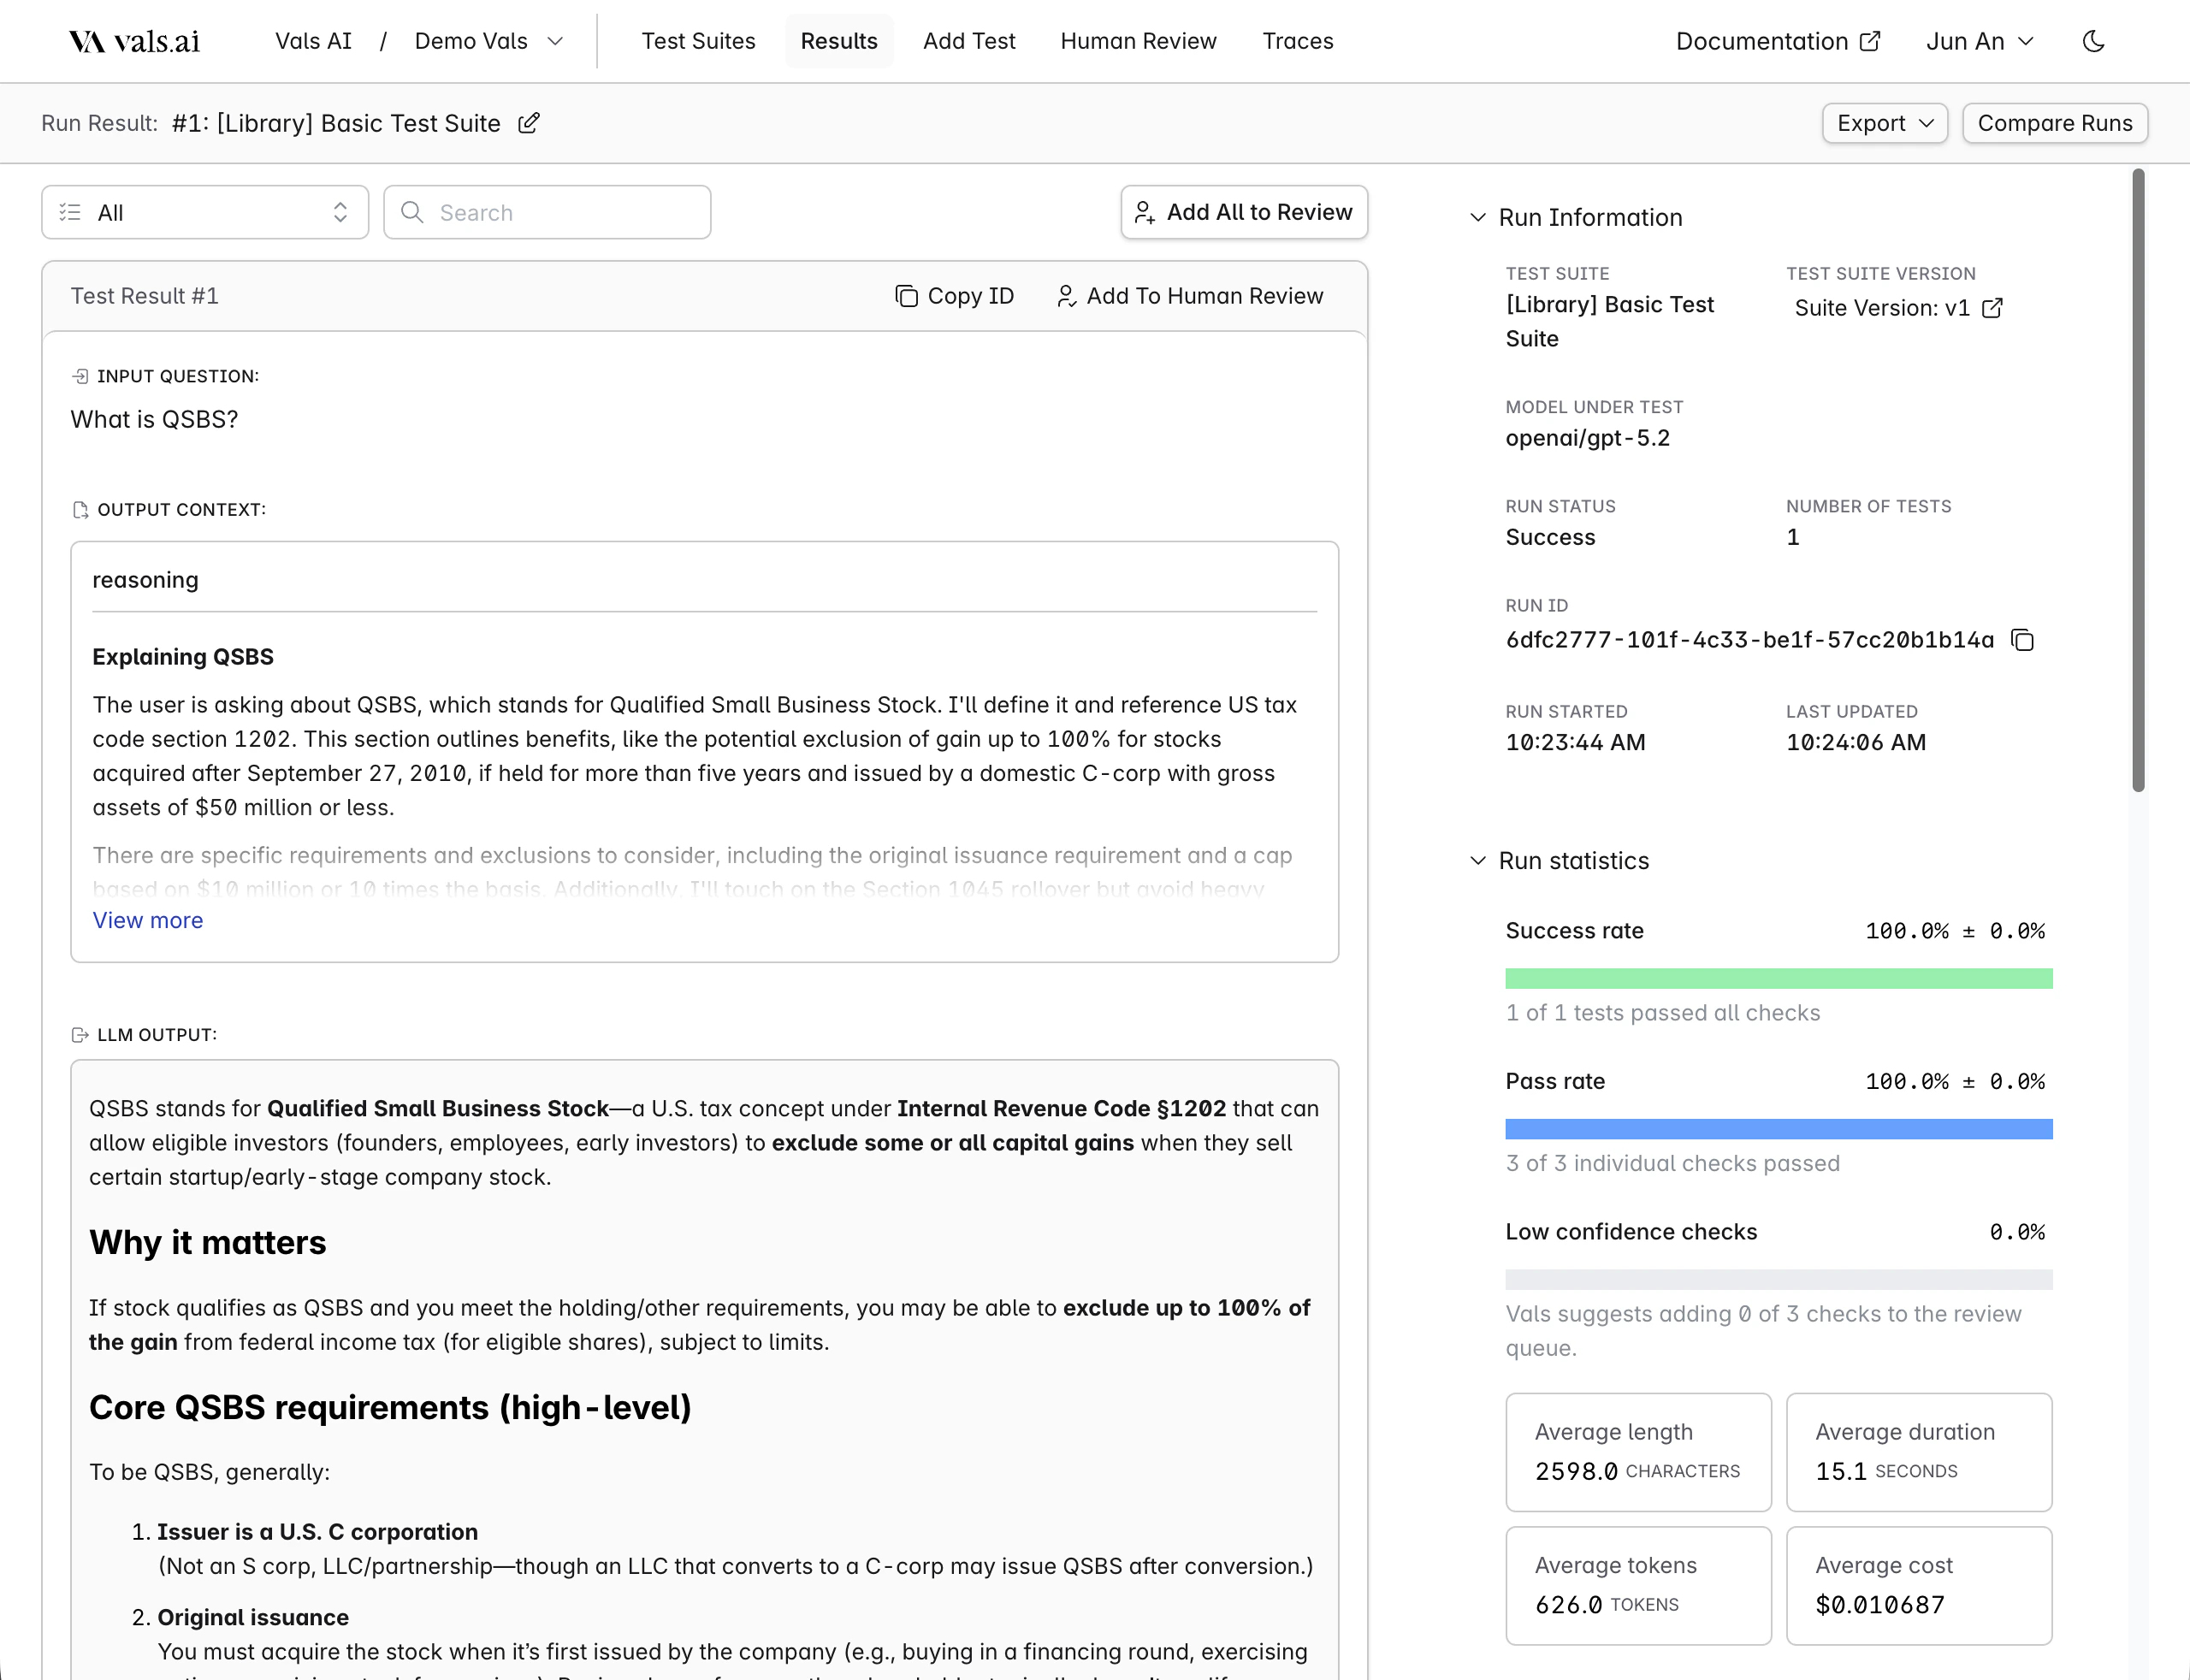
Filtering
| Feature | Options/Actions |
|---|---|
| Filter by Check Status | Checks Passed Checks Failed Some Checks Failed |
| Filter by Attributes | Tag Has Output Error Has Low Confidence Checks |
| Search Includes | Input Output Checks LLM Feedback Context |
Confidence
Statistics
Several statistics are reported for every run.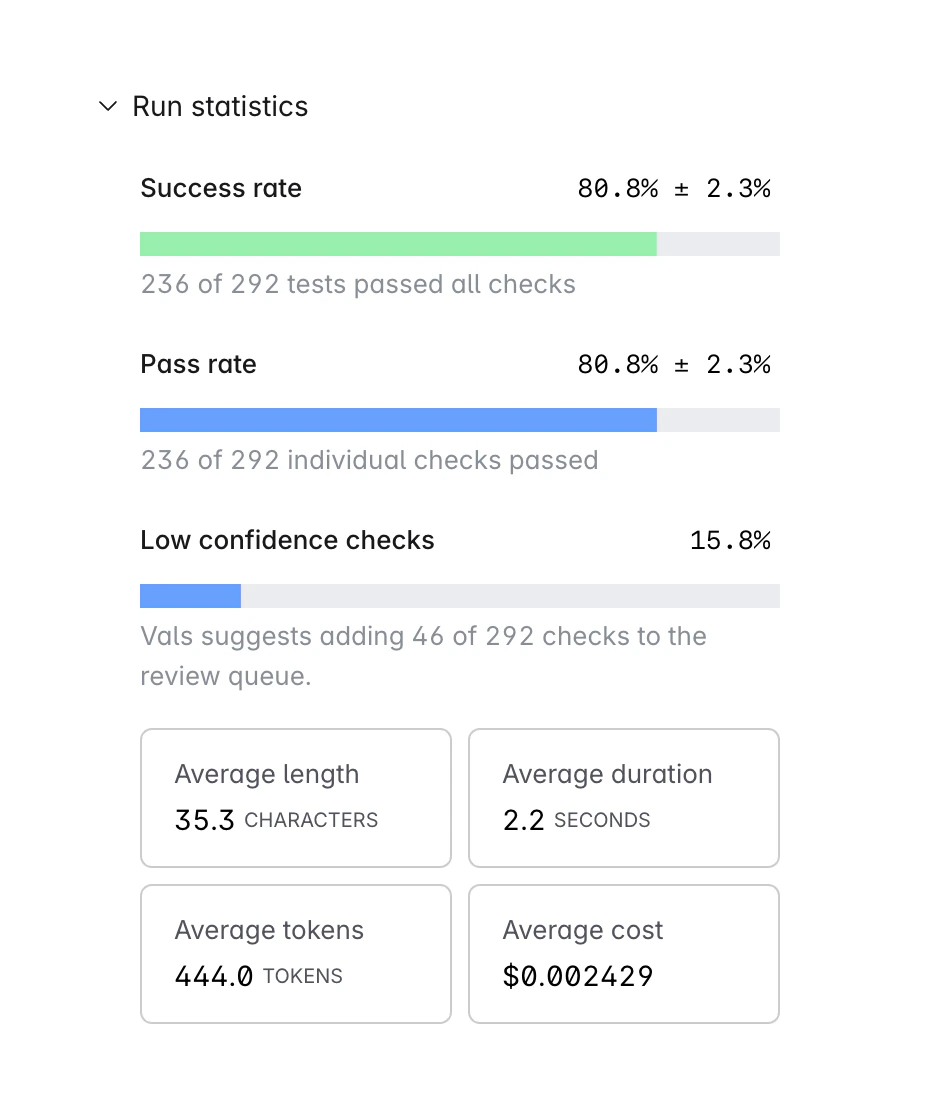
- Success Rate: This is the percentage of tests in which all tests passed. For example, lets say there are four tests, each with two checks each. The first two get 2/2 points, the third gets 1/2 points, and the last gets 0/2. The success rate is 50% - 2/4 tests had all their checks pass.
- Pass Rate: This is the raw percentage of checks that passed - regardless of which test they belong to. So, if there are 8 checks across 4 tests, and 6 passed, then the pass rate is 75%.
- Low Confidence Rate: This is the percentage of tests that the system flagged as low confidence.
Comparisons
You can choose to compare two runs either through the table or when looking at a single run. This allows you to see the results of two runs side by side - this is commonly done to see the differences between two models.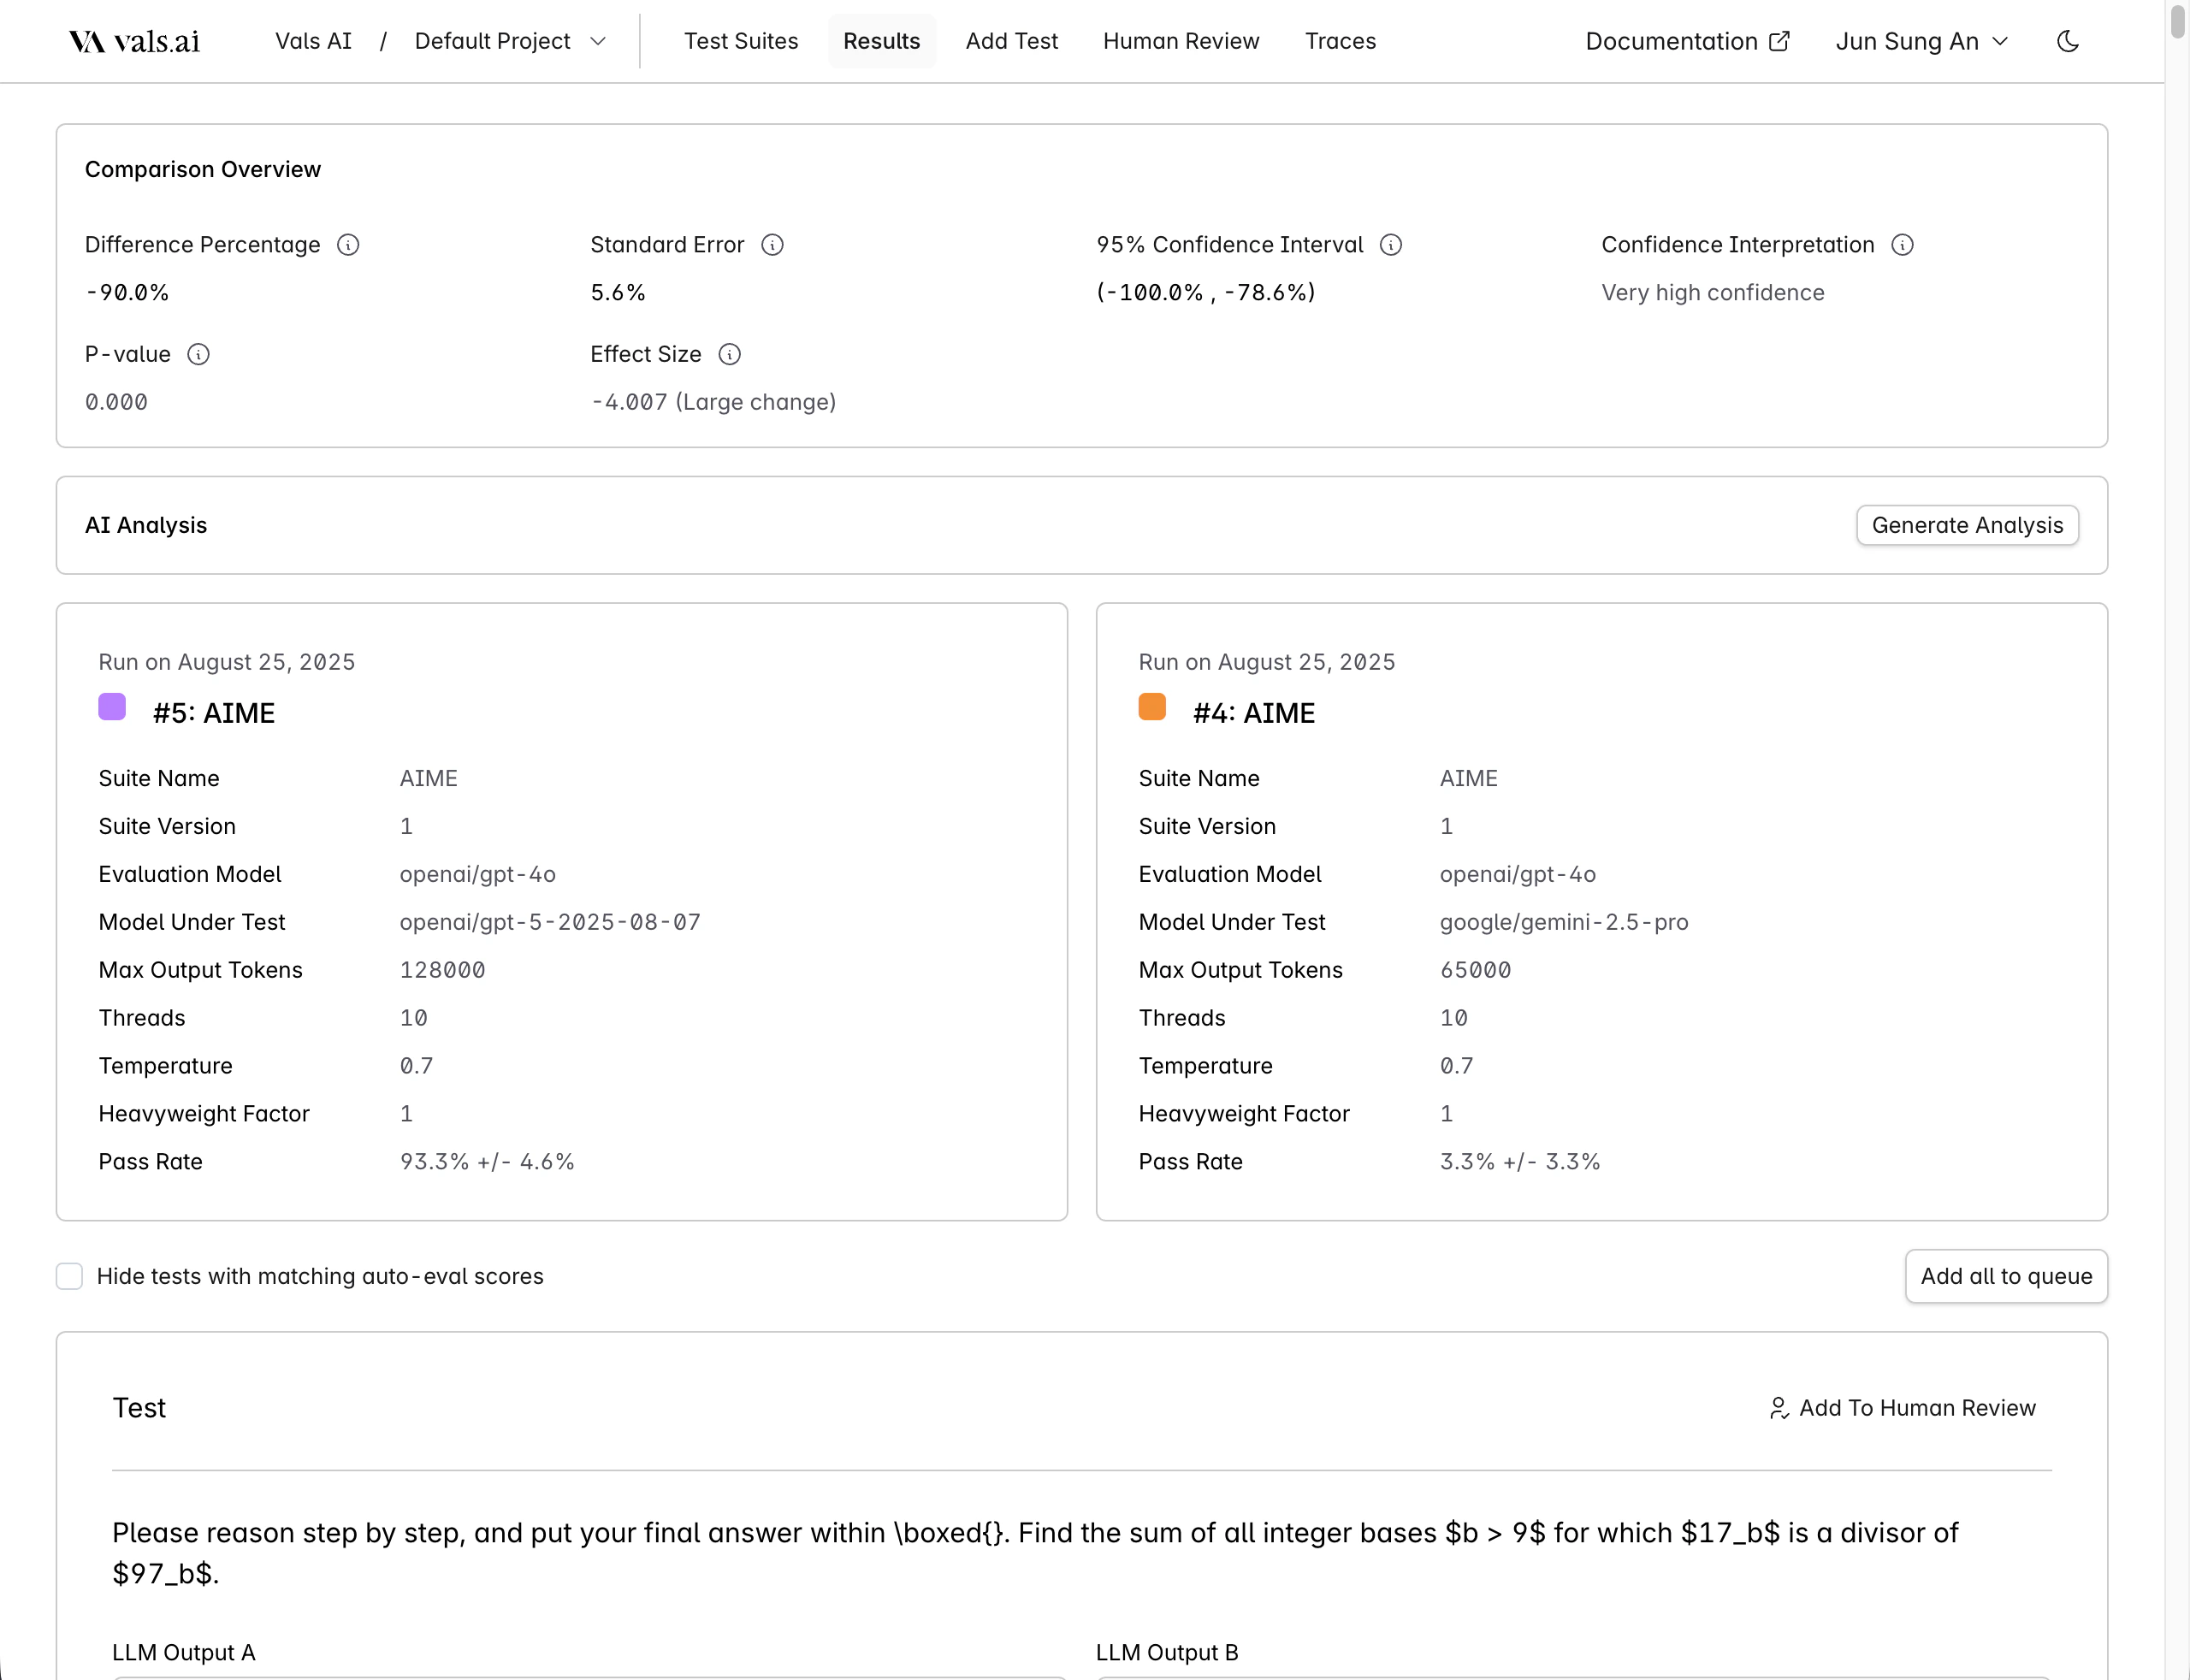
Hide tests with matching auto-eval scores to show only tests that were marked differently by the auto-grader.