> ## Documentation Index
> Fetch the complete documentation index at: https://docs.vals.ai/llms.txt
> Use this file to discover all available pages before exploring further.
# Viewing Results
## Table
All results are displayed in the results tab in the table.
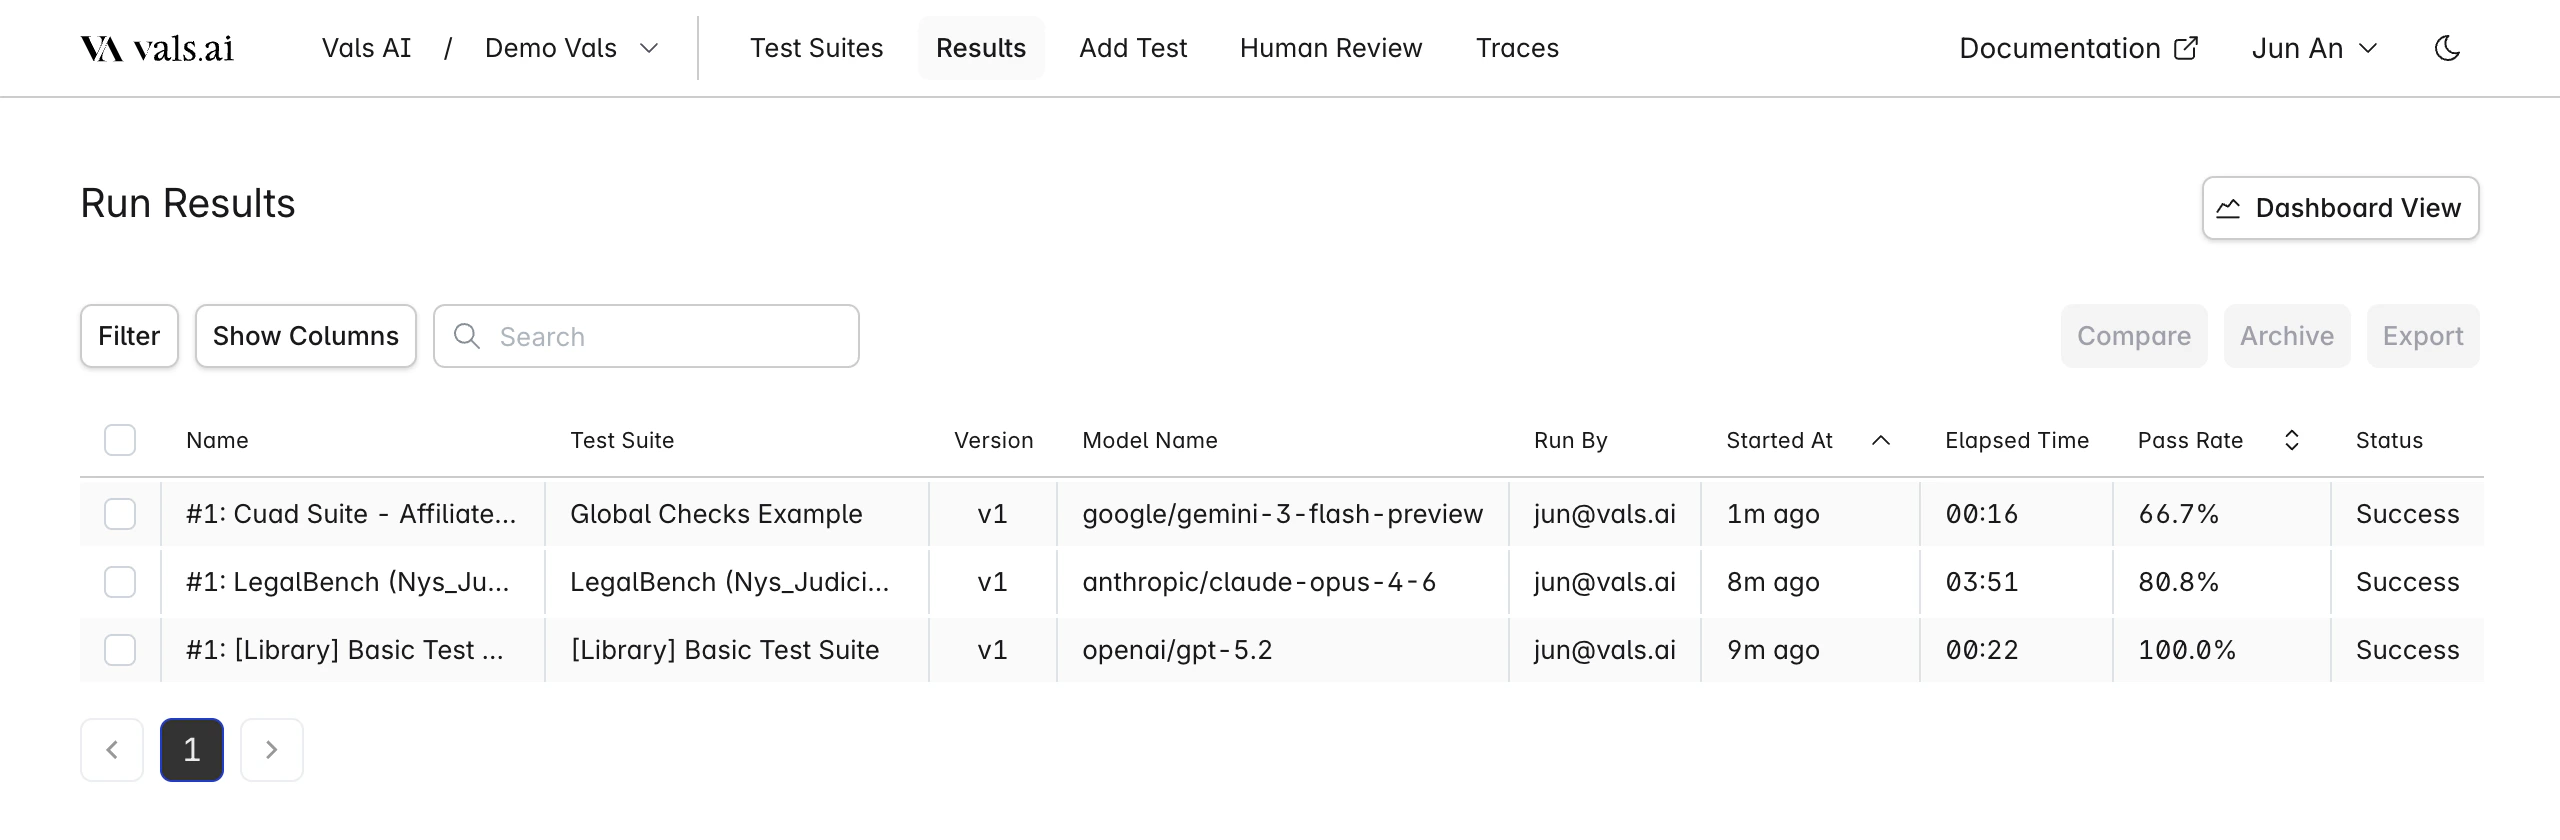 | Feature | Options/Actions |
| ------------------- | ------------------------------------------------- |
| **Filter by** | `Model` `Status` `Test Suite` `Run By` `Archived` |
| **Search Includes** | `Run Name` `Test Suite Name` |
| **Sort by** | `Pass Rate` `Run Date` |
| **Show Columns** | Toggle visibility of individual table columns |
There are a few actions available when you select one or more runs from the table:
* **Compare**: Compare the results of two selected runs. They must be from the same test suite.
* **Archive**: Archive a selected run. It will no longer be displayed unless the `Archived` filter is selected
* **Export**: Export one or more selected runs to a CSV file.
## Single Run
Clicking on a row will bring you to the single run page.
| Feature | Options/Actions |
| ------------------- | ------------------------------------------------- |
| **Filter by** | `Model` `Status` `Test Suite` `Run By` `Archived` |
| **Search Includes** | `Run Name` `Test Suite Name` |
| **Sort by** | `Pass Rate` `Run Date` |
| **Show Columns** | Toggle visibility of individual table columns |
There are a few actions available when you select one or more runs from the table:
* **Compare**: Compare the results of two selected runs. They must be from the same test suite.
* **Archive**: Archive a selected run. It will no longer be displayed unless the `Archived` filter is selected
* **Export**: Export one or more selected runs to a CSV file.
## Single Run
Clicking on a row will bring you to the single run page.
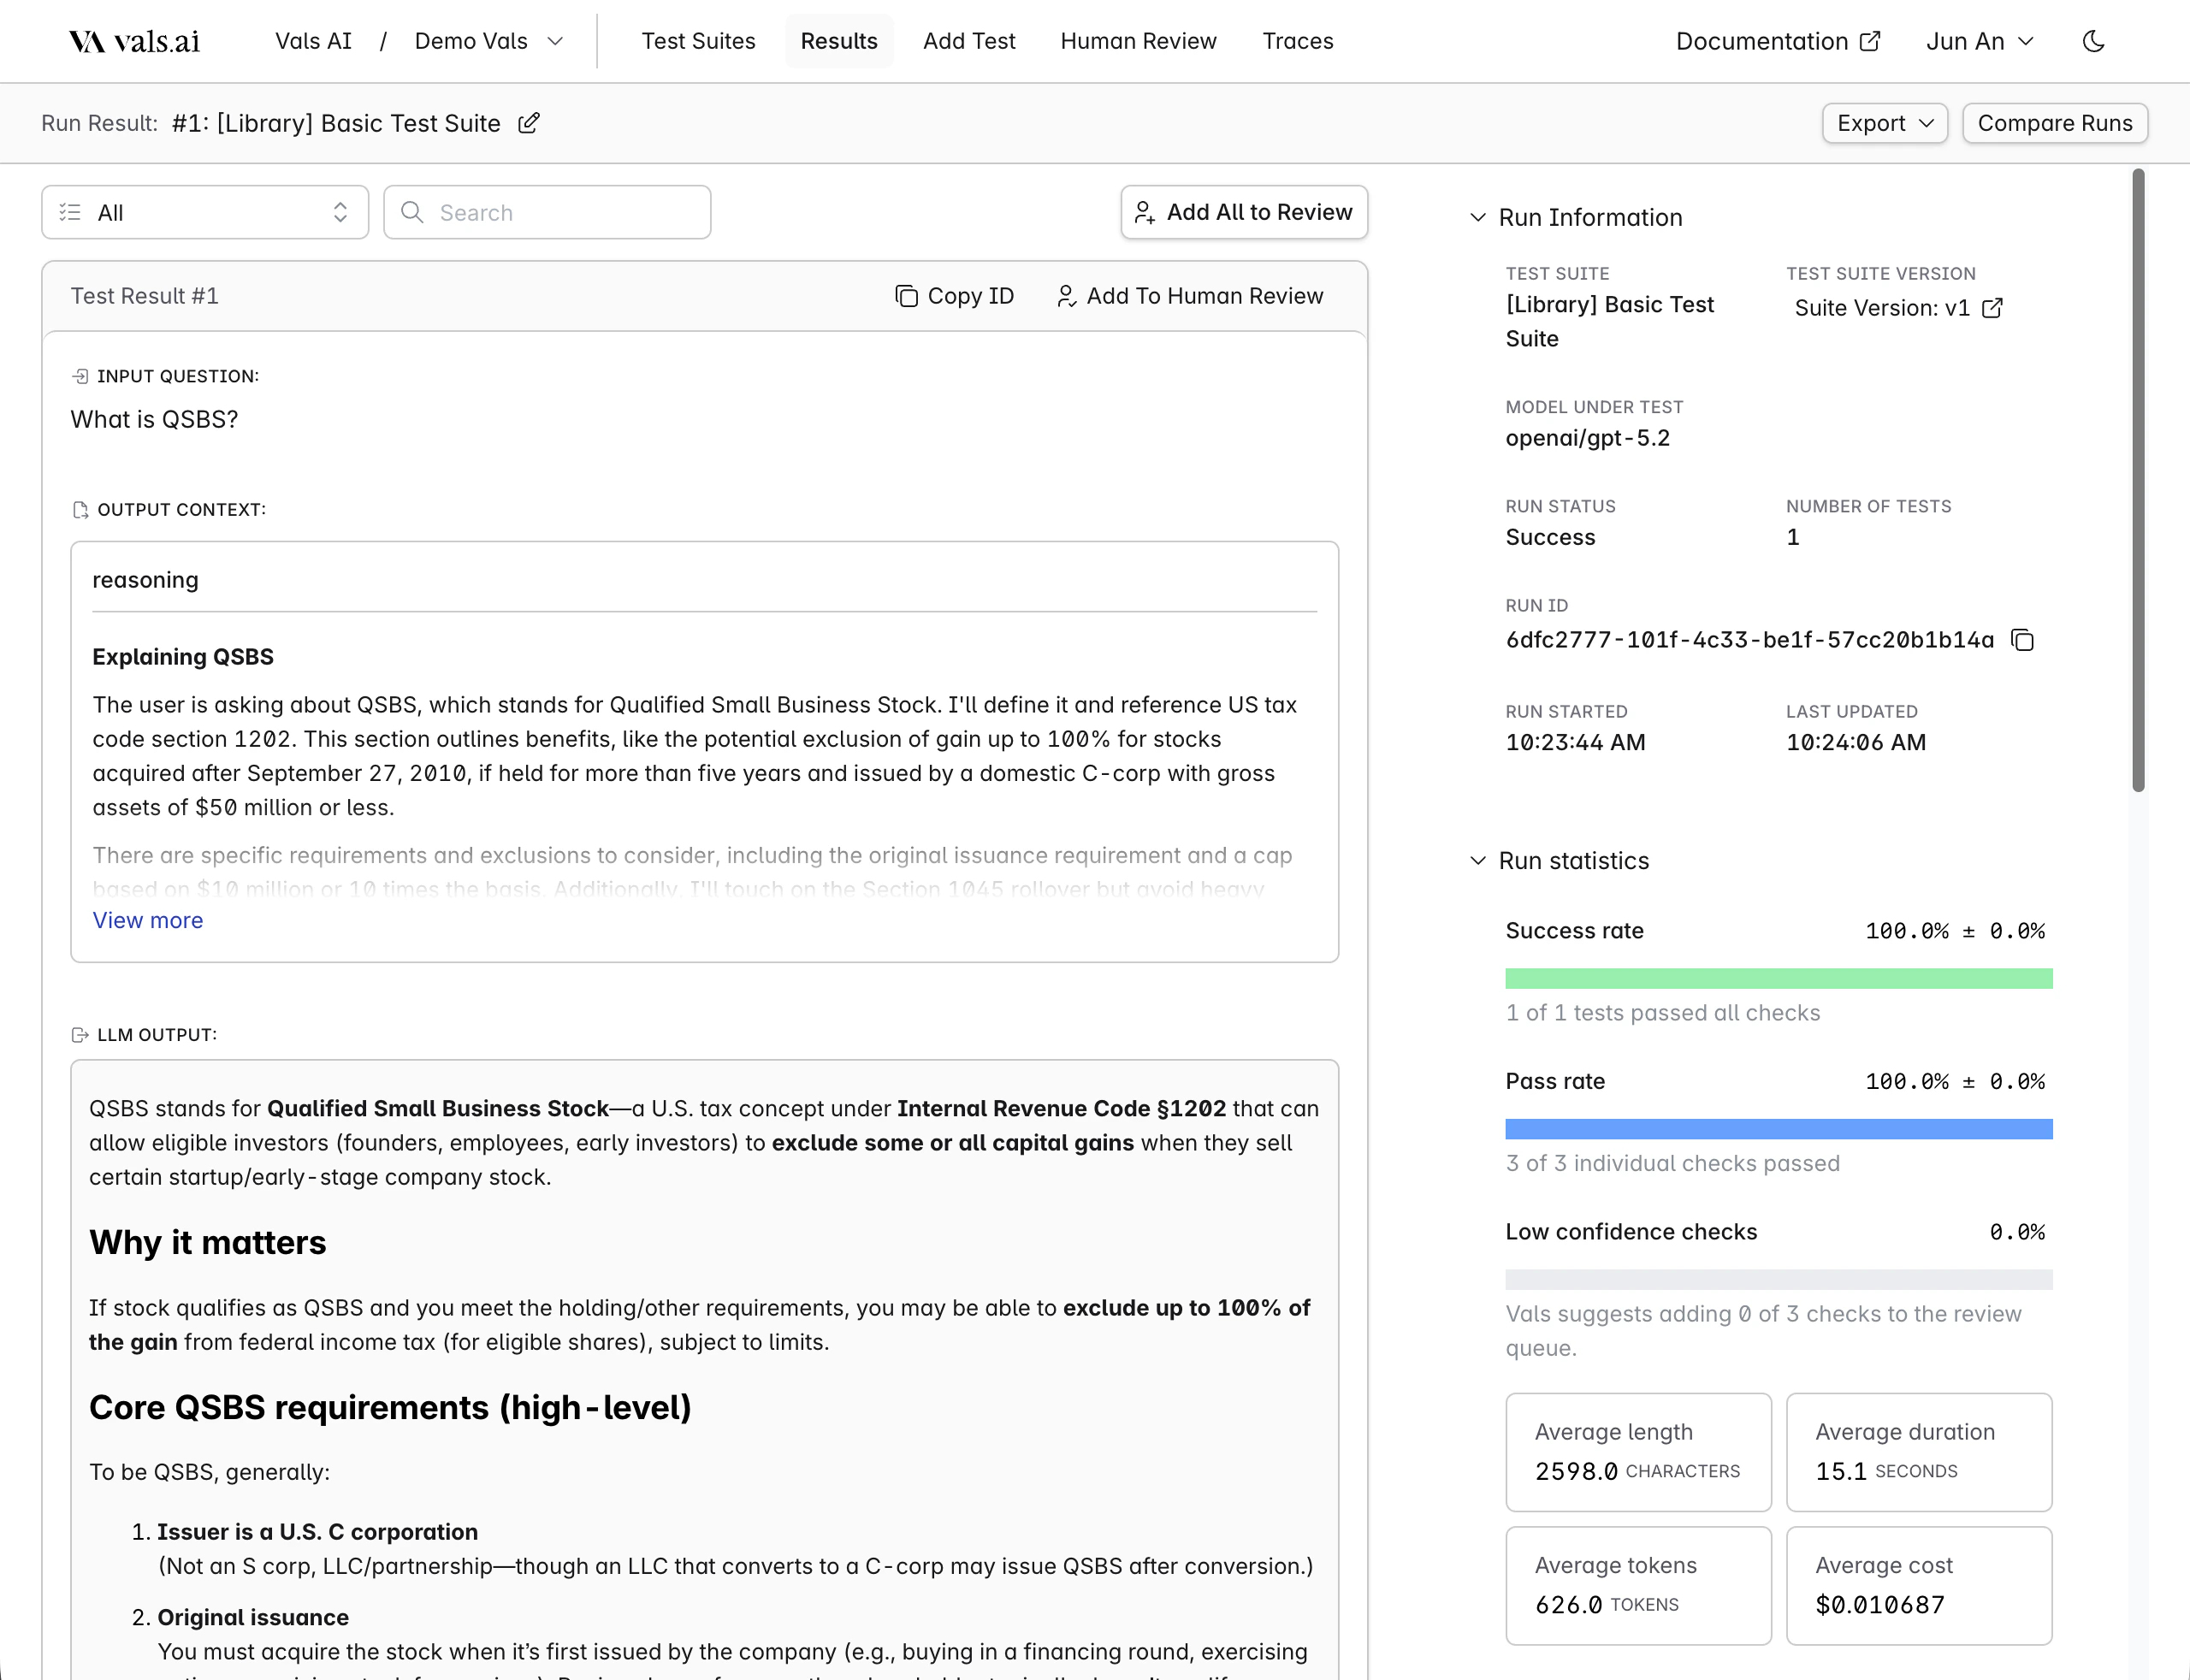 On the left, for each test result, it shows input, output, check results, and other metrics
The right contains top-level information about the run - including statistics, error analysis, and run parameters.
### Filtering
| Feature | Options/Actions |
| -------------------------- | ---------------------------------------------------- |
| **Filter by Check Status** | `Checks Passed` `Checks Failed` `Some Checks Failed` |
| **Filter by Attributes** | `Tag` `Has Output Error` `Has Low Confidence Checks` |
| **Search Includes** | `Input` `Output` `Checks` `LLM Feedback` `Context` |
### Confidence
On the left, for each test result, it shows input, output, check results, and other metrics
The right contains top-level information about the run - including statistics, error analysis, and run parameters.
### Filtering
| Feature | Options/Actions |
| -------------------------- | ---------------------------------------------------- |
| **Filter by Check Status** | `Checks Passed` `Checks Failed` `Some Checks Failed` |
| **Filter by Attributes** | `Tag` `Has Output Error` `Has Low Confidence Checks` |
| **Search Includes** | `Input` `Output` `Checks` `LLM Feedback` `Context` |
### Confidence
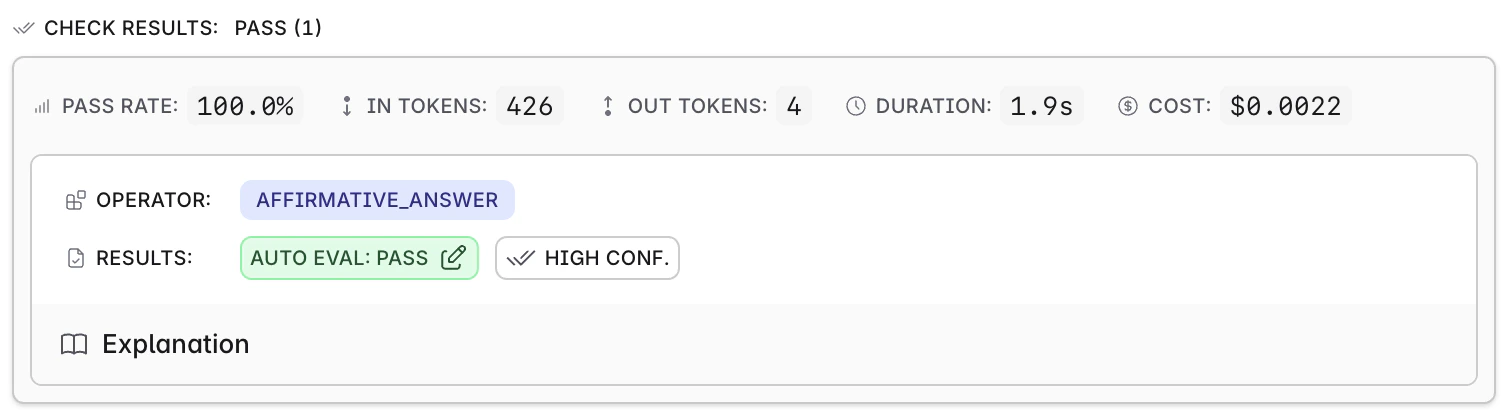 By default, the Vals system will compute a confidence for every test - either "High" or "Low". If the confidence is "High", this means our system has flagged that it is very likely we've graded this output correctly. If the confidence is "Low", then it means there is greater uncertainty or ambiguity in either the grading or in the criteria.
The confidence score is listed in each check next to the grade.
### Statistics
Several statistics are reported for every run.
By default, the Vals system will compute a confidence for every test - either "High" or "Low". If the confidence is "High", this means our system has flagged that it is very likely we've graded this output correctly. If the confidence is "Low", then it means there is greater uncertainty or ambiguity in either the grading or in the criteria.
The confidence score is listed in each check next to the grade.
### Statistics
Several statistics are reported for every run.
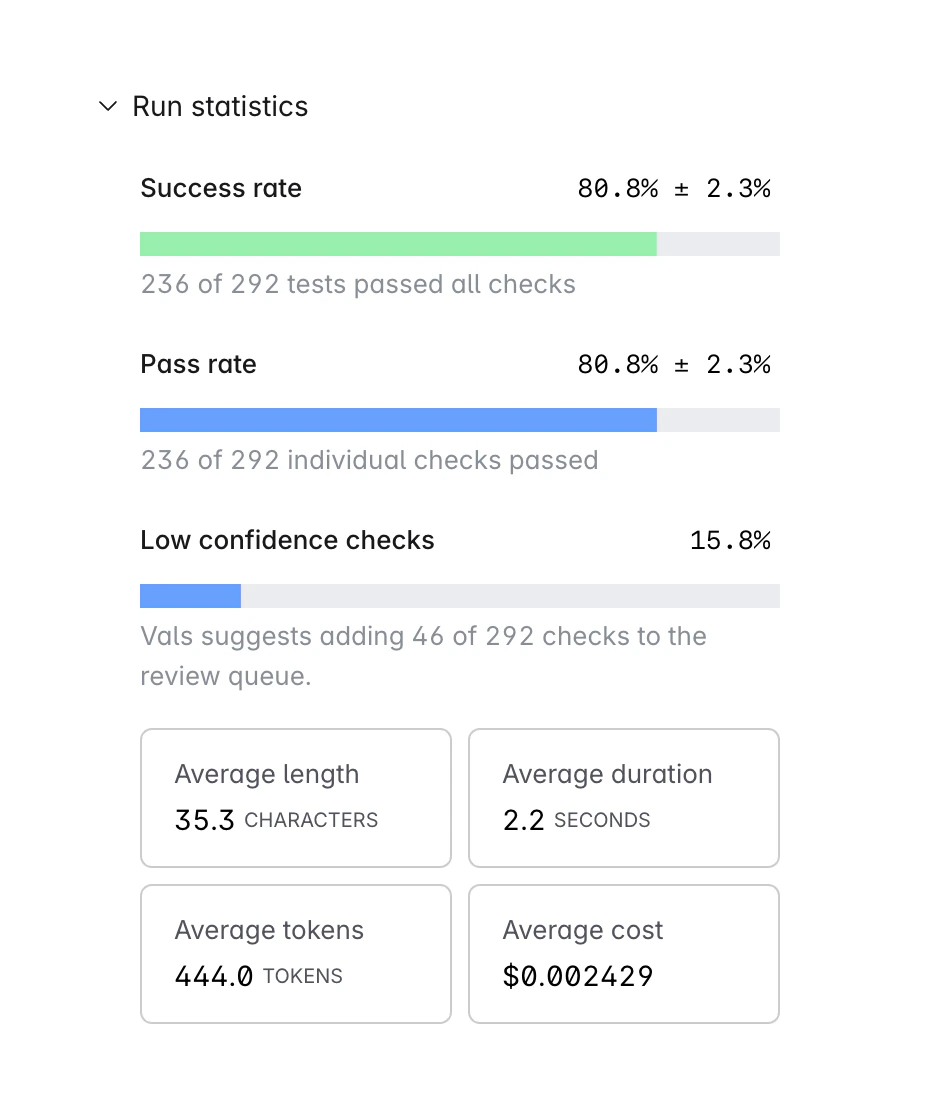 * **Success Rate**: This is the percentage of tests in which all tests passed. For example, lets say there are four tests, each with two checks each. The first two get 2/2 points, the third gets 1/2 points, and the last gets 0/2. The success rate is 50% - 2/4 tests had all their checks pass.
* **Pass Rate**: This is the raw percentage of checks that passed - regardless of which test they belong to. So, if there are 8 checks across 4 tests, and 6 passed, then the pass rate is 75%.
* **Low Confidence Rate**: This is the percentage of tests that the system flagged as low confidence.
Additionally, each check is by default given a certain category: e.g. "Correctness", "Format", "Style", etc. The run result page will also show a pass percentage for each category (note: the categories can be overridden).
Finally, if tags are assigned to each test, it will show a performance breakdown by tag.
## Comparisons
You can choose to compare two runs either through the table or when looking at a single run. This allows you to see the results of two runs side by side - this is commonly done to see the differences between two models.
* **Success Rate**: This is the percentage of tests in which all tests passed. For example, lets say there are four tests, each with two checks each. The first two get 2/2 points, the third gets 1/2 points, and the last gets 0/2. The success rate is 50% - 2/4 tests had all their checks pass.
* **Pass Rate**: This is the raw percentage of checks that passed - regardless of which test they belong to. So, if there are 8 checks across 4 tests, and 6 passed, then the pass rate is 75%.
* **Low Confidence Rate**: This is the percentage of tests that the system flagged as low confidence.
Additionally, each check is by default given a certain category: e.g. "Correctness", "Format", "Style", etc. The run result page will also show a pass percentage for each category (note: the categories can be overridden).
Finally, if tags are assigned to each test, it will show a performance breakdown by tag.
## Comparisons
You can choose to compare two runs either through the table or when looking at a single run. This allows you to see the results of two runs side by side - this is commonly done to see the differences between two models.
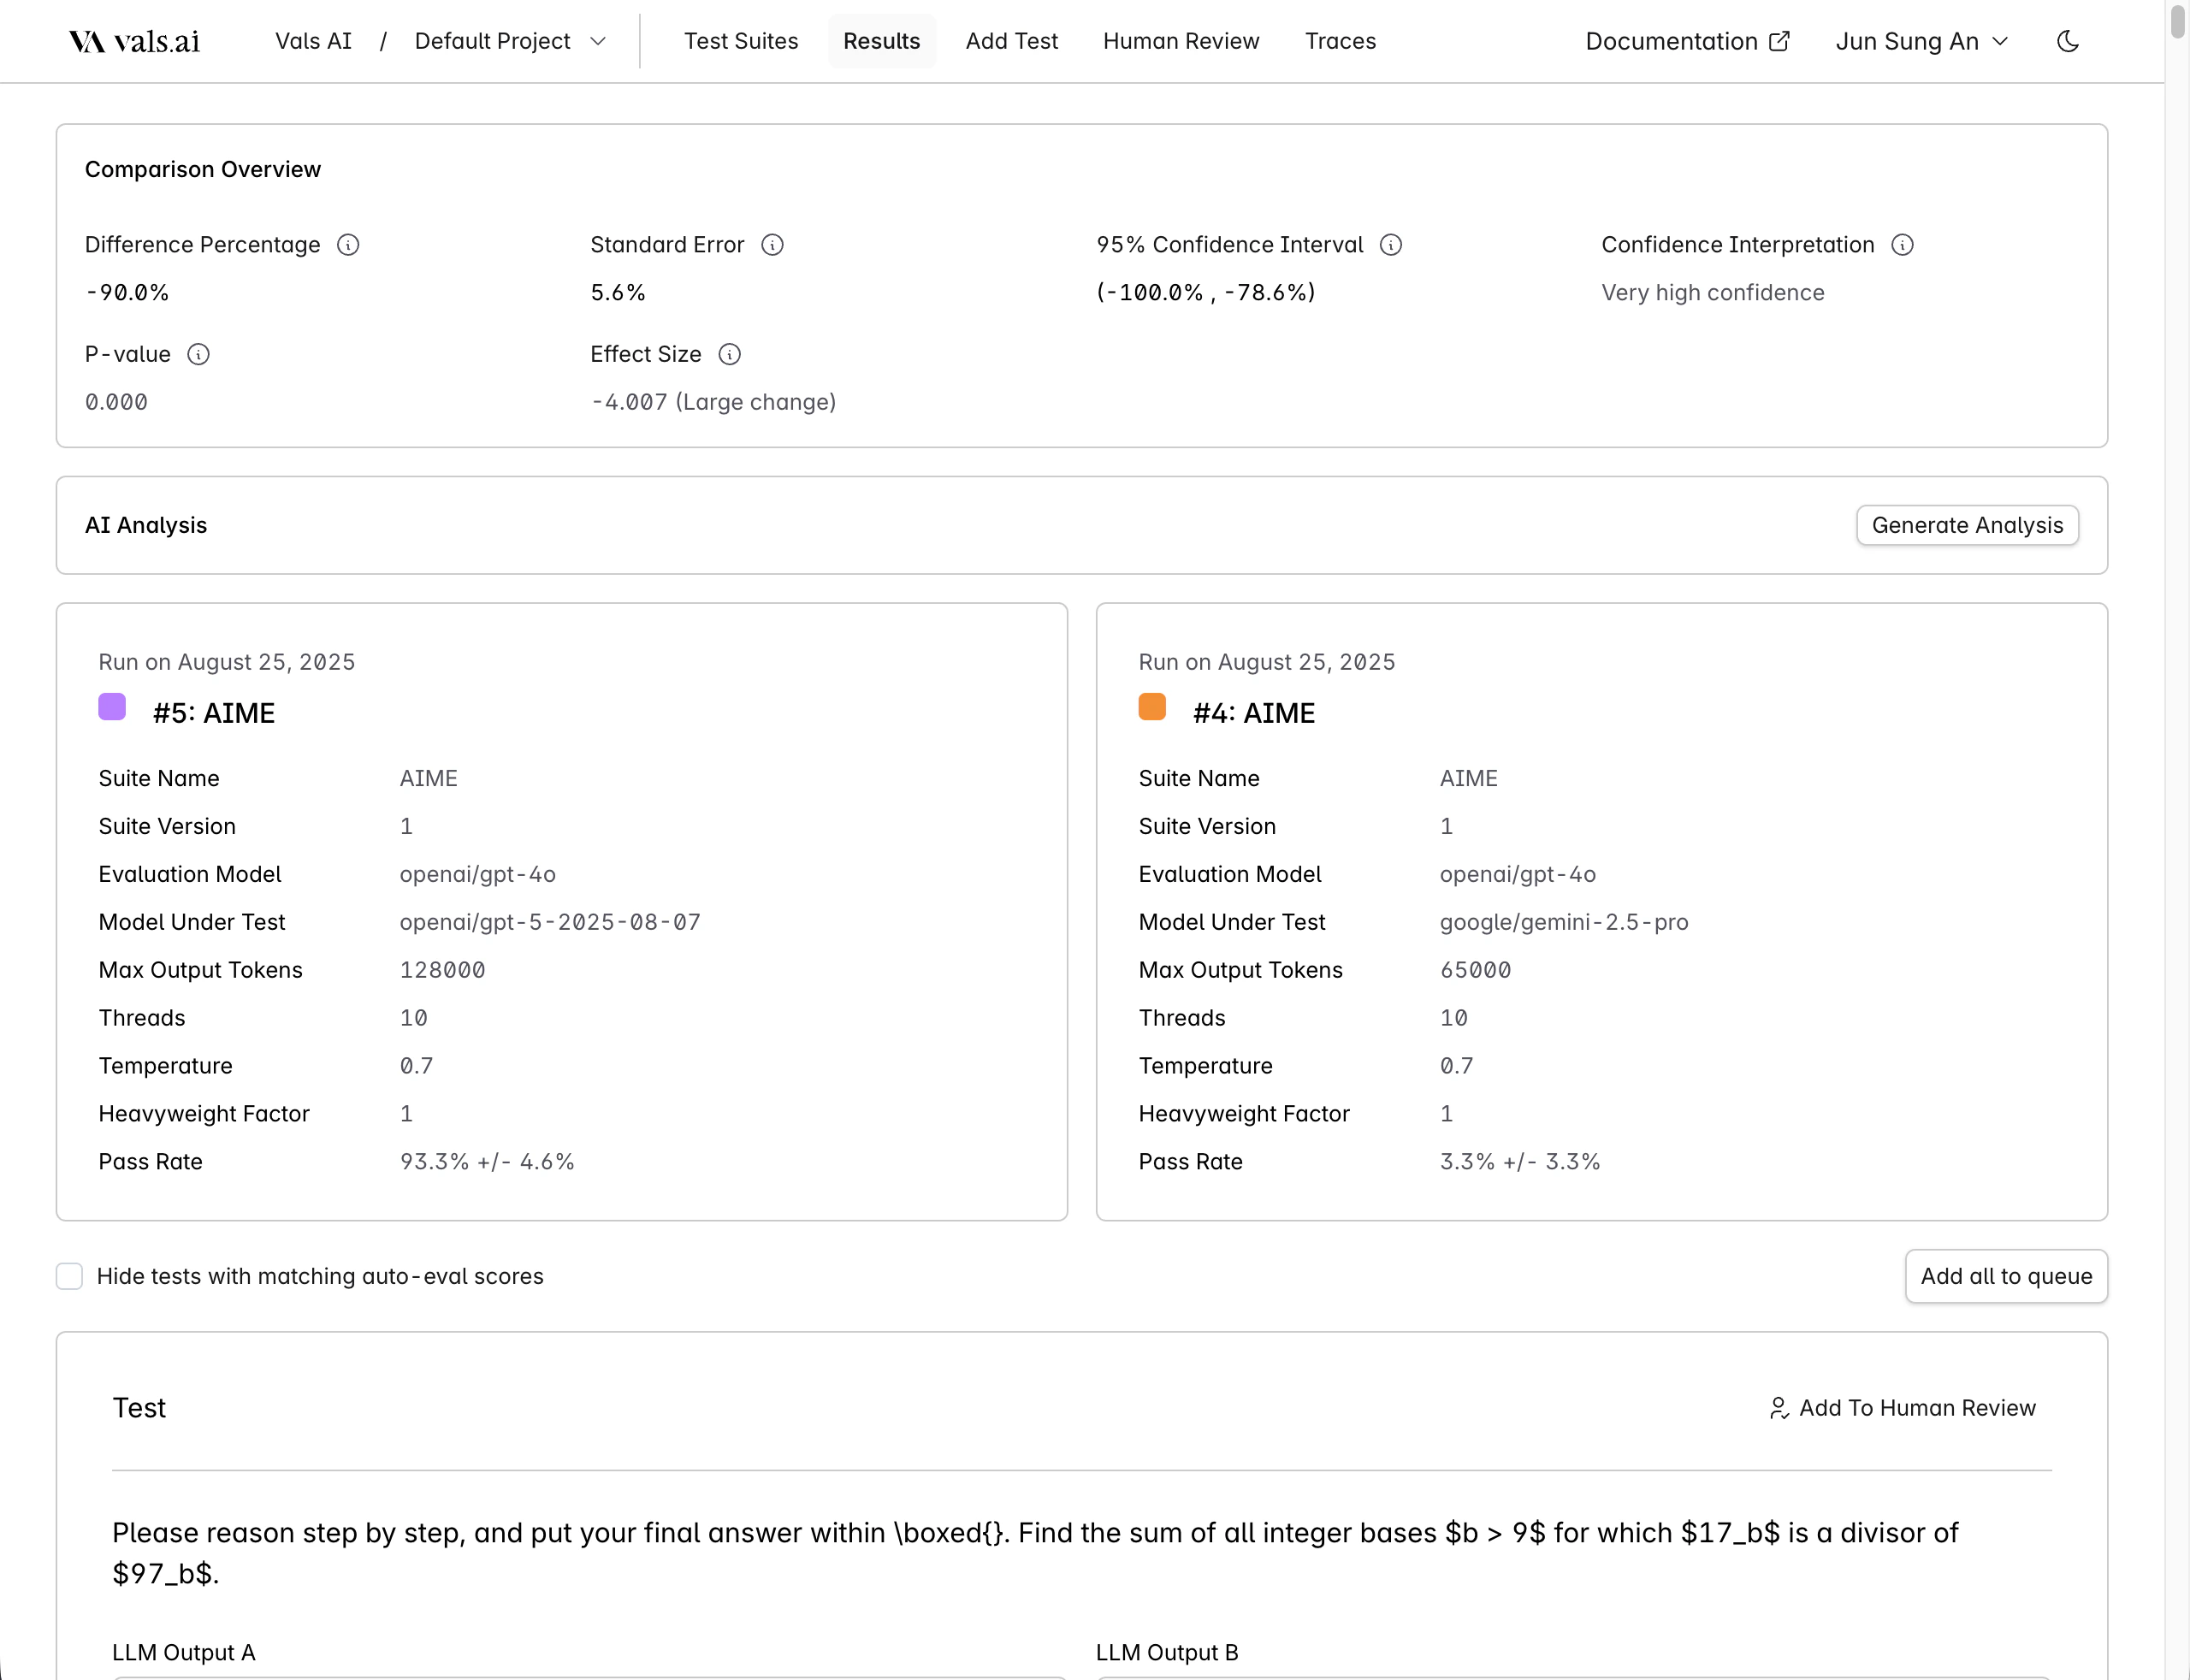 We automatically compute several statistics, such as the likelihood of a statistically significant difference between the two runs.
Toggle `Hide tests with matching auto-eval scores` to show only tests that were marked differently by the auto-grader.
We automatically compute several statistics, such as the likelihood of a statistically significant difference between the two runs.
Toggle `Hide tests with matching auto-eval scores` to show only tests that were marked differently by the auto-grader.